You can find this document as PDF here.
1. About
The FromDual Performance Monitor is a alternative to the MySQL Enterprise Monitor from Oracle/MySQL which is only available for paying Oracle customers.
With the FromDual Performance Monitor you can monitor your MariaDB, Galera Cluster, Percona Server, MySQL and even PostgreSQL databases and also your database machines. The FromDual Performance Monitor works on Linux and should also work on Mac OSX (and possibly some other UNIX and BSD derivatives).
The FromDual Performance Monitor provides all the necessary modules to monitor your database performance metrics in detail and let you display them graphically.
The FromDual Performance Monitor is based on the enterprise open source monitoring solution Zabbix. A Zabbix Server must be installed somewhere in your network for storing the performance metrics. On the Zabbix Web Interface you can monitor the performance graphs, and alerts are sent to you by your Zabbix Server.
Find out more about Zabbix installation here.
2. Installation Guide
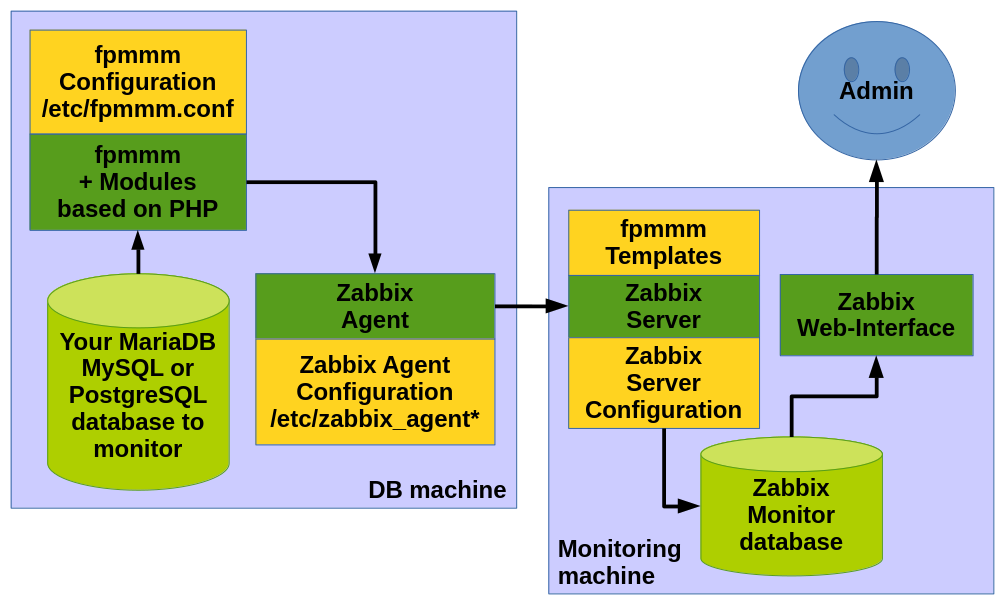
2.1. Architecture overview
2.2. Prerequisites
You need a separate machine where your Zabbix Server can me installed (displaying the graphs, send alerts, etc.). On this machine you have to install a Zabbix Server and the Zabbix Web Interface. For installing Zabbix go through this installation first.
If you do NOT want to set-up your own Zabbix Monitoring Server you should consider our Monitoring as a Service (MaaS) offering.
On the machine where your database resides you have to install a Zabbix Agent (zabbix_agentd), the Zabbix Sender (zabbix_sender) and the Performance Monitor.
|
Important
|
The Performance Monitor was only tested on Linux. It may work on other Unix-like operating systems but most probably will NOT work on Windows yet. Please let us know if you plan to run the FromDual Performance Monitor on-premises or as a Service (MaaS) on Windows… |
2.3. Download and install Performance Monitor
FromDual offers you 2 different methods how you can install the Performance Monitor:
-
Use our FromDual repository.
-
Use our tarballs. The most recent FromDual Performance Monitor tarball can be downloaded from our website.
We follow the Debian, Ubuntu and Rocky Linux distribution maintenance policies for Long Term Support (LTS) releases.
|
Note
|
Other distributions like Red Hat, Oracle Linux, AlmaLinux, CentOS, Fedora and other Debian based distributions may work as well. Please let us know if you experience any problem with those. |
2.4. Adding FromDual DEB or RPM repositories
Adding the FromDual DEB or RPM repositories is described here.
2.5. Installation of the Performance Monitor from our Repository on Debian and Ubuntu
|
Note
|
Special requirement on Ubuntu 24.04: This Ubuntu version does NOT provide a Zabbix agent any more. Thus you have to add the Zabbix repository first. |
Make sure you have added the FromDual DEB repository first. Then you can install the Performance Monitor as follows:
$ apt update
$ apt install fpmmm
To test if the installation was successful see Testing Performance Monitor installation.
2.6. Installation of the Performance Monitor from our Repository on Rocky Linux, Red Hat Linux, Oracle Linux, AlmaLinux, Fedora and CentOS
|
Note
|
Rocky Linux does NOT provide a Zabbix agent. Thus you have to add the Zabbix repository first. |
Make sure you have added the FromDual RPM repository first. Then you can install the Performance Monitor as follows:
$ dnf install zabbix-sender   # This step is possibly not needed any more?
$ dnf install fpmmm
To test if the installation was successful see Testing Performance Monitor installation.
2.7. Installation of the Performance Monitor from a tarball
If you are installing the Performance Monitor from a tarball some preparation work has to be done beforehand.
2.7.1. Prerequisites
The following packages have to be installed. They may be named differently depending on your distribution:
-
DEB:
$ apt install php-cli php-mysql php-curl zabbix-sender zabbix-agent zabbix-agent2 smartmontools sysstat sudo
-
RPM:
$ dnf install php php-cli php-mysqli php-process php-json smartmontools sysstat zabbix-agent zabbix-sender which
2.7.2. Download and installation
To install the Performance Monitor from a tarball proceed as follows:
$ VERSION='2.2.1'
$ cd /tmp
$ wget --no-check-certificate https://support.fromdual.com/admin/download/fpmmm-${VERSION}.tar.gz
$ cd /opt
$ tar xf /tmp/fpmmm-${VERSION}.tar.gz
$ ln -s fpmmm-${VERSION} fpmmm
$ cp fpmmm/tpl/fpmmm.conf.template /etc/fpmmm.conf
$ chown zabbix: /etc/fpmmm.conf
$ chmod 600 /etc/fpmmm.conf
2.7.3. Configuration
Additionally you have to set some PHP variables (choose the right file depending on your distribution):
$ PHP_INI='/etc/php.d/20-fpmmm.ini'
$ PHP_INI='/etc/php/8.5/mods-available/fpmmm.ini'
$ PHP_INI='/etc/php/cli/conf.d/fpmmm.ini'
$ PHP_INI='/etc/php/conf.d/fpmmm.ini'
$ PHP_INI='/etc/php.d/fpmmm.ini'

$ cat << _EOF >${PHP_INI}
variables_order = "EGPCS"
date.timezone = 'Europe/Zurich'
_EOF

$ phpenmod fpmmm
and add smartctl to the sudoers file if you want to make use of smartctl (machine module smart):
Details
$ cat << _EOF >/etc/sudoers.d/fpmmm
root ALL=(root) NOPASSWD: /usr/sbin/smartctl
_EOF
2.8. Testing FromDual Performance Monitor installation
$ php --version   # PHP version should be at least 7.2
$ /opt/fpmmm/bin/fpmmm --version
2.2.1
$ /opt/fpmmm/bin/fpmmm --config=/etc/fpmmm.conf
1
$ cat /var/log/fpmmm/fpmmm.log
2.9. Configuration of the FromDual Performance Monitor
A configuration file template can be found under ./tpl/fpmmm.conf.template.
Prepare the FromDual Performance Monitor configuration file fpmmm.conf according to your needs.
A typical FromDual Performance Monitor configuration file could look as follows:
# Put everything related to fpmmm agent/daemon itself into this section
[self]

# How long fpmmm should sleep when run as daemon
Interval      = 60
MyPidFile     = /run/lock/fpmmm/fpmmm.pid


# Put everything in here which belongs to all instances/machines
[default]

# Type of section:
# instance for a normal MariaDB/MySQL database
# machine for a server
# Type          = instance

# LogLevels are:
# 1 is logging only errors
# 2 is logging errors and warnings (this is the default)
# 3 logs some informations messages as well
# 4 logs everything (for debugging purposes only)

LogLevel      = 2
LogFile       = /var/log/fpmmm/fpmmm.log
# Base name of the fpmmm cache files
CacheFileBase = /var/cache/fpmmm/fpmmm
# Currently supported formats are zabbix, nagios, icinga, centreon and snmp, default is zabbix
# OutputFormat  = zabbix
AgentLockFile = /run/lock/fpmmm/fpmmm.lock

# If you agent is not located in the same time zone as your server
# For US something like -6.0 to our MaaS Server
# For Asia something like +7.0 to our MaaS Server
# TimeShift     = +0.0
TimeZone      = Europe/Zurich

# Zabbix Server IP address
ZabbixServer  = <127.0.0.1>

# Can be one of: minimal, nomal, extensive
DataGathering = normal

# Here you could enter the hostname of your machine (uname -n)
[<my_machine>]          # This MUST match Hostname in Zabbix!

Type          = machine
Modules       = fpmmm server


# All MySQL databases here
# Try to avoid section names with spaces!

# Here you could add a random name of your MySQL/MariaDB instance
[<my_mysqld>]          # This MUST match Hostname in Zabbix!

Type          = instance

Username      = <fpmmm_agent>
Password      = <secret>
MysqlHost     = <127.0.0.1>
MysqlPort     = 3306
Modules       = process mysql myisam innodb master slave security data user
DbPidFile     = /run/mysqld/mysqld.pid
There is typically a default section ([default]) where you can specify all the defaults for all the 'hosts' to monitor (machines and database instances).
For every database instance you want to monitor you have to add an extra section. This allows you to monitor several MariaDB/MySQL/PostgreSQL database instances running on the same machine (rare cases).
|
Important
|
The configuration file section name ([<some name>]) MUST match exactly the Hostname in the Zabbix Server!!!
|
2.10. FromDual Performance Monitor Modules
The FromDual Performance Monitor can call several different Modules. For every Module there is a:
-
Zabbix Template (
tpl/templates_??/Template_FromDual.{db|system}.*_??.xml) -
FromDual Performance Monitor PHP module (
lib/FromDual_*.inc)
Each module is for its own specific purpose. There are modules for monitoring databases and modules for monitoring the machine (server). Available modules are:
Machine monitoring modules
| Module | Description |
|---|---|
drbd |
Module to monitor DRBD device status information. |
fpmmm* |
Module to monitor the FromDual Performance Monitor itself. This module is mandatory because it triggers the send process. |
memcached |
Module to monitor MemcacheD services. |
server |
Module to monitor a Linux machine (additional metrics related to database use). |
smart |
Module to query some S.M.A.R.T metrics. |
* Required module
Database monitoring modules
| Module | Description |
|---|---|
aria |
Module to monitor the MariaDB Aria Storage Engine. |
backup |
Module to monitor database backups. |
data |
Module to monitor database data growth (user data). |
errorlog |
Module to monitor the database Error Log. No dedicated Zabbix template available. |
galera |
Module to monitor Galera Cluster. |
innodb |
Module to monitor the MariaDB and MySQL InnoDB Storage Engine. |
master |
Module to monitor a Replication Master in a MariaDB/MySQL Master/Slave Replication (synonyms: primary, replication source). |
myisam |
Module to monitor the MyISAM Storage Engine. |
mysql |
Module to monitor general MariaDB/MySQL behaviour (everything NOT storage engine specific). |
postgtresql |
Module to monitor a PostgreSQL database. |
process |
Module to monitor all kinds of Linux processes ( |
restore |
Module to monitor database restores. |
security |
Module to monitor security related information and rules. |
slave |
Module to monitor Replication Slaves in a MariaDB/MySQL Master/Slave set-up (synonyms: replica, secondary). |
user |
Module to monitor user specific information. |
2.11. Create a Monitoring User in your database instance
2.11.1. Monitoring User for MariaDB/MySQL databases
For security reason it is a good idea to NOT use the database user root or mysql. The monitoring user needs some privileges to gather information from the database.
Create MySQL/MariaDB database user:
SQL> CREATE USER 'fpmmm_agent'@'127.0.0.1' IDENTIFIED BY 'secret';

SQL> GRANT PROCESS ON *.* TO 'fpmmm_agent'@'127.0.0.1';
SQL> GRANT REPLICATION CLIENT ON *.* TO 'fpmmm_agent'@'127.0.0.1';
SQL> GRANT SELECT ON `mysql`.`user` TO 'fpmmm_agent'@'127.0.0.1';
SQL> GRANT REPLICATION SLAVE ON *.* TO 'fpmmm_agent'@'127.0.0.1';

SQL> GRANT SELECT ON performance_schema.events_statements_summary_by_user_by_event_name TO fpmmm_agent@'127.0.0.1';
SQL> GRANT SELECT ON performance_schema.events_statements_current TO fpmmm_agent@'127.0.0.1';
SQL> GRANT SELECT ON performance_schema.setup_instruments TO fpmmm_agent@'127.0.0.1';
SQL> GRANT SELECT ON performance_schema.metadata_locks TO fpmmm_agent@'127.0.0.1';
SQL> GRANT SELECT ON performance_schema.threads TO fpmmm_agent@'127.0.0.1';

SQL> -- For the security module
SQL> GRANT SELECT ON mysql.user TO 'fpmmm_agent'@'127.0.0.1';

SQL> -- MariaDB only
SQL> INSTALL PLUGIN metadata_lock_info SONAME 'metadata_lock_info.so';

SQL> -- MariaDB
SQL> GRANT SELECT ON mysql.global_priv TO fpmmm_agent@'127.0.0.1';
SQL> GRANT REPLICATION MASTER ADMIN ON *.* TO 'fpmmm_agent'@'127.0.0.1';
SQL> GRANT SLAVE MONITOR ON *.* TO 'fpmmm_agent'@'127.0.0.1';
2.11.2. Monitoring User for PostgreSQL databases
To create a PostgreSQL database user look here.
2.12. FromDual Performance Monitor as a Service (MaaS) Installation Guide
2.12.1. Monitoring as a Service (MaaS)
If you do not want to take the burden to install the Monitoring Server yourself we offer you our Monitoring as a Service (MaaS).
2.12.2. How to install FromDual Performance Monitor for MaaS
To install a FromDual Performance Monitor for MaaS you have to install it normally as described above on your MariaDB/MySQL/PostgreSQL database machine. It will collect data about your machine and your database and send them to the remote service which is provided by FromDual for its customers.
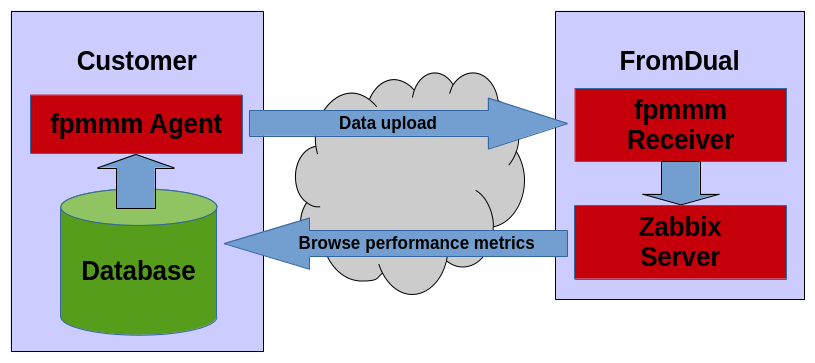
The data are uploaded via a https file uploads. So only a one way communication is possible! We cannot access your systems! Only you (and our engineers) can see your performance data on the Monitoring Server.
2.12.3. How to configure FromDual Performance Monitor for MaaS
Configure your FromDual Performance Monitor for MaaS agent as described above.
To make the FromDual Performance Monitor work in a MaaS set-up you need a hash key delivered by FromDual so we can identify your traffic non-ambiguously and we can make sure nobody is doing nasty things with your service. You can request such a hash key, if you have not received yet one from us, here. To allocate you the correct resources we further need to know from you:
-
The company name (
<company>) you want to use (for example 'MyCompany') -
The server name (
<server_name>) the agent is running on (for example 'deb13db1') -
A name which identifies your database instance (
<dn_name>) (for example 'db1')
All those 3 identifiers together must uniquely identify your database instance you want to monitor. When we got these information we can create the service for you and provide you a configuration file.
The MaaS configuration file then will look as follows:
[self]

Interval      = 60
MyPidFile     = /run/lock/fpmmm/fpmmm.pid


[default]

LogLevel      = 2
LogFile       = /var/log/fpmmm/fpmmm.log
CacheFileBase = /var/cache/fpmmm/fpmmm
AgentLockFile = /run/lock/fpmmm/fpmmm.lock

MaaS          = on
Hash          = <hash value>
Method        = https
Url           = https://support.fromdual.com/maas/receiver.php


[<company>.<server_name>]

Type          = machine
Modules       = fpmmm server


[<company>.<server_name>.<db_name>]

Type          = instance

Modules       = process mysql myisam innodb master slave security data user

Username      = <root>
Password      = <secret>
MysqlHost     = <127.0.0.1>
MysqlPort     = (3306)
DbPidFile     = /run/mysqld/<server_name>.pid>
We need one section for the machine (aka host, server) and one section per database (aka instance, typically only one per machine).
2.12.4. Queries sent against the database
The following queries are sent against your database for monitoring:
-
SHOW BINARY LOGS -
SHOW /*!50000 ENGINE */ INNODB STATUS -
SHOW ENGINE NDB STATUS -
SHOW /*!50000 GLOBAL */ STATUS -
SHOW GLOBAL VARIABLES -
SHOW MASTER STATUS -
SHOW SLAVE HOSTS -
SHOW SLAVE STATUS -
SELECT counter_name, SUM(val) AS val FROM ndbinfo.counters GROUP BY counter_name -
SELECT MAX(total) AS total, MAX(used) AS used FROM ndbinfo.logbuffers -
SELECT memory_type, SUM(used) AS used, SUM(total) AS total FROM ndbinfo.memoryusage GROUP BY memory_type -
SELECT ROUND(AVG(uptime), 0) AS uptime, SUM(start_phase) AS start_phase FROM ndbinfo.nodes -
SELECT resource_name, SUM(reserved) AS reserved, SUM(used) AS used, SUM(max) AS max FROM ndbinfo.resources GROUP BY resource_name -
SELECT status, COUNT(status) AS cnt FROM ndbinfo.transporters GROUP BY status -
SELECT REPLACE(Name, ' ', '_') AS Name, Value FROM INFORMATION_SCHEMA.PBXT_STATISTICS -
SELECT SUM(compress_time) AS compress_time, SUM(uncompress_time) AS uncompress_time FROM information_schema.INNODB_CMP -
SELECT SUM(total) AS total, SUM(used) AS used FROM ndbinfo.logspaces -
SELECT SUM(trx_rows_locked) AS rows_locked, SUM(trx_rows_modified) AS rows_modified, SUM(trx_lock_memory_bytes) AS lock_memory FROM information_schema.INNODB_TRX -
SELECT LOWER(REPLACE(trx_state, " ", "_")) AS state, count(*) AS cnt from information_schema.INNODB_TRX GROUP BY state
2.12.5. Testing the FromDual Performance Monitor for MaaS
If you have put all the configuration in place you can run the FromDual Performance Monitor agent for a first test:
$ /opt/fpmmm/bin/fpmmm --config=/etc/fpmmm.conf
1
If the agent returns "1" then it seems to work correctly… Have a look at the FromDual Performance Monitor log file (/var/log/fpmmm/fpmmm.log) as well for hidden problems. If you do not see there any message it should have worked correctly.
Then you should see the first data arriving in the Zabbix Monitor.
2.12.6. Viewing Performance data
To see your performance data go to our web-site: support.fromdual.com/mpm and log in with the credentials we provided you.
Then go to Monitoring → Latest data and choose the right Group and Host. It may take some time until Zabbix recognizes a new agent (up to a minute) and displays its data correctly.
If the first data have arrived correctly you can continue sending your data to our Monitor as a Service. If not please get in contact with us for finding the problem.
2.12.7. Continuously sending data
If everything works correctly you can include the agent into the crontab (of the mysql user) as follows:
* * * * * /opt/fpmmm/bin/fpmmm --config=/etc/fpmmm.conf | grep -v '^1$'
2.12.8. Upgrading the FromDual Performance Monitor MaaS agent
The FromDual Performance Monitor for MaaS agent is upgraded in the same way as the normal FromDual Performance Monitor. For more details see here.
2.13. FromDual Performance Monitor Installation Guide for Windows
FromDual Performance Monitor is NOT tested to run on Windows. If you plan do so we strongly recommend to talk to us before.
To install the FromDual Performance Monitor on Windows you first have to install PHP.
2.13.1. Run the FromDual Performance Monitor every minute
To run the FromDual Performance Monitor every minute you need the Windows Task Scheduler. You can schedule your task either by using the command line:
cmd> schtasks /create /sc minute /mo 1 /tn "FromDual Performance Monitor" \
/tr "C:\fpmmm\bin\fpmmm.php C:\fpmmm\fpmmm.conf"
or by using the GUI. Go to:
Computer (right click) > Manager > System Tools > Task Scheduler > Create Task...
2.13.2. FromDual Performance Monitor modules which work
The modules which seem to work at least partially at the moment are:
-
master -
fpmmm -
myisam -
mysql -
slave
Other modules might work as well…
The modules server and process will NOT work for sure!
2.13.3. A basic FromDual Performance Monitor configuration file on Windows
We have used the following basic configuration file:
[default]

LogFile       = C:\Users\oli\logs\fpmmm.log
Debug         = 2

CacheFileBase = C:\Users\oli\cache

MaaS          = on
Hash          = <your hash>
Methtode      = http
Url           = https://support.fromdual.com/maas/receiver.php

[FromDual.Win_laptop]

Modules       = fpmmm

[FromDual.Win_laptop.win_db]

Modules       = master fpmmm myisam mysql slave

Username      = <root>
Password      = <secret>
MysqlHost     = <127.0.0.1>
MysqlPort     = (3306)
In your case there is possibly some more configuration needed. For details please look here.
If you run into problems please report them to us: contact@fromdual.com. All paying customers can naturally relay on our support services!
3. User Guide
3.1. Technical Overview
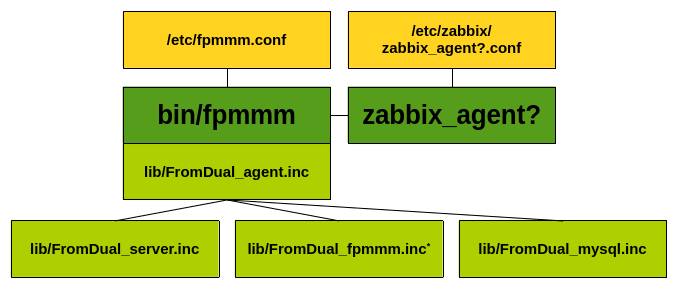
The FromDual Performance Monitor will be hooked into the Zabbix Agent (zabbix_agentd).
It consists of:
-
The Monitor program itself (
bin/fpmmm) which controls the other modules and its own module (FromDual_agent.inc) -
A Template for the FromDual Performance Monitor configuration file (
tpl/fpmmm.conf.template) -
And several different modules for monitoring MariaDB/Galera/MySQL/PostgreSQL (
lib/FromDual_*.inc)
The FromDual Performance Monitor Architecture looks as follows:
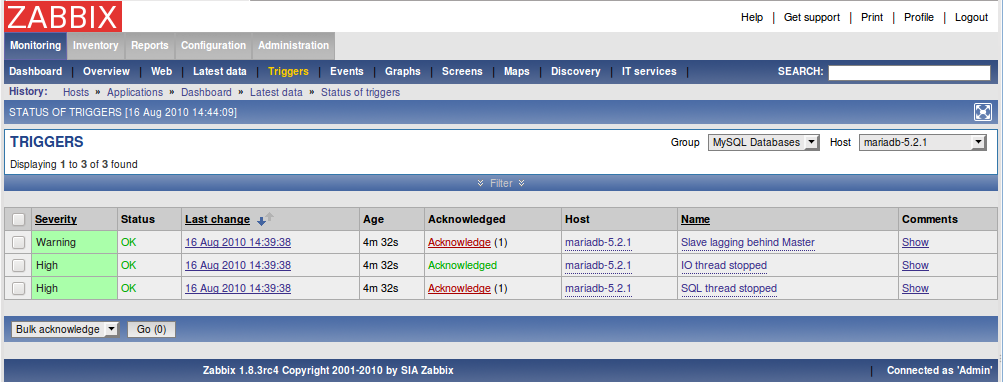
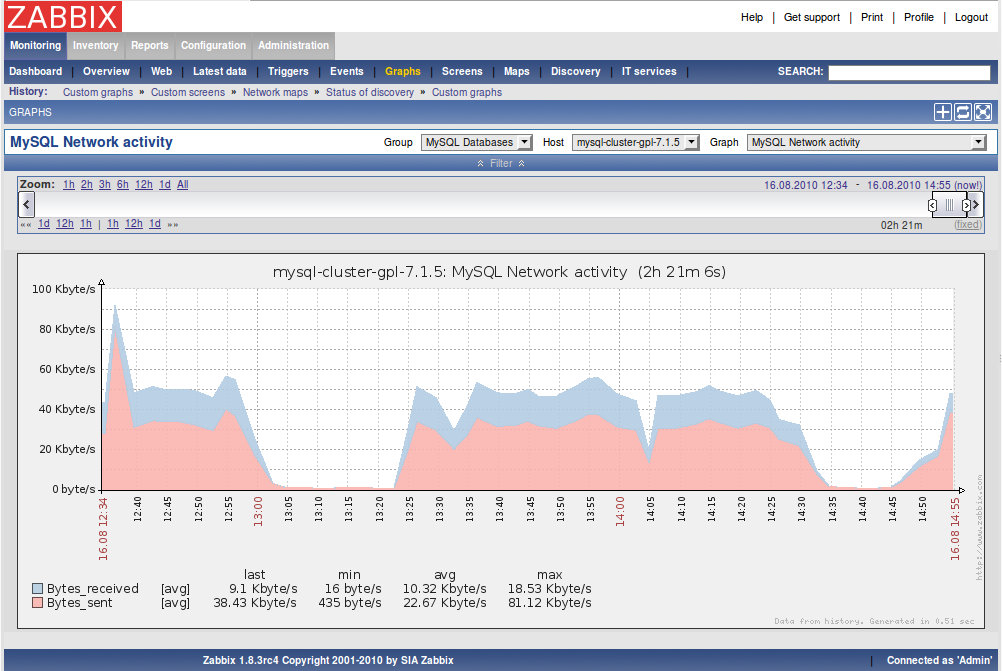
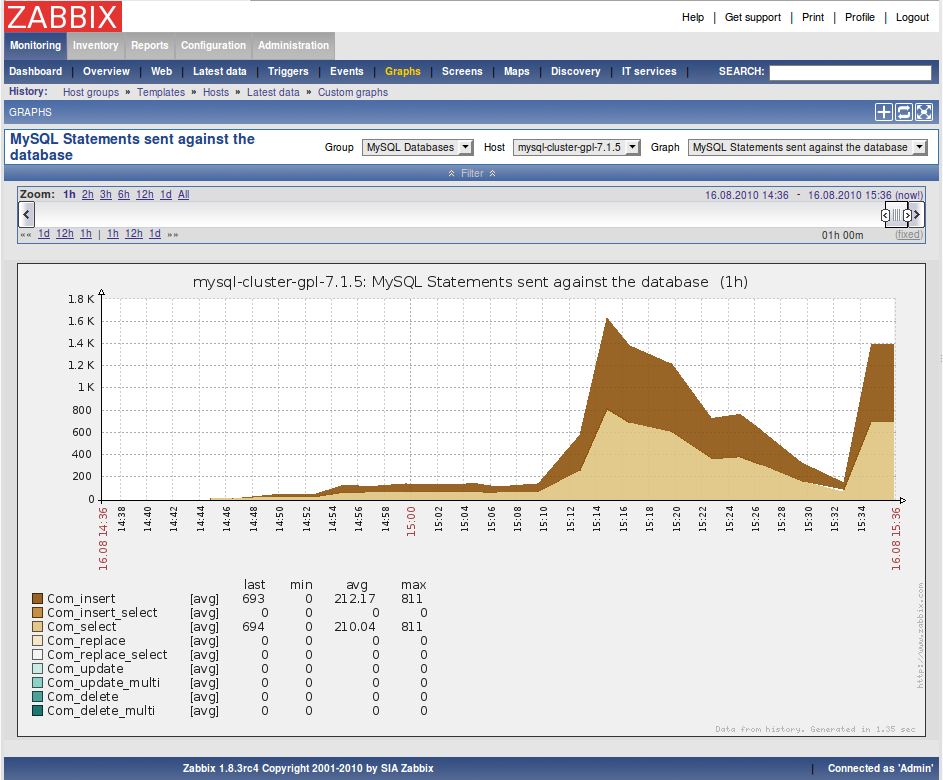
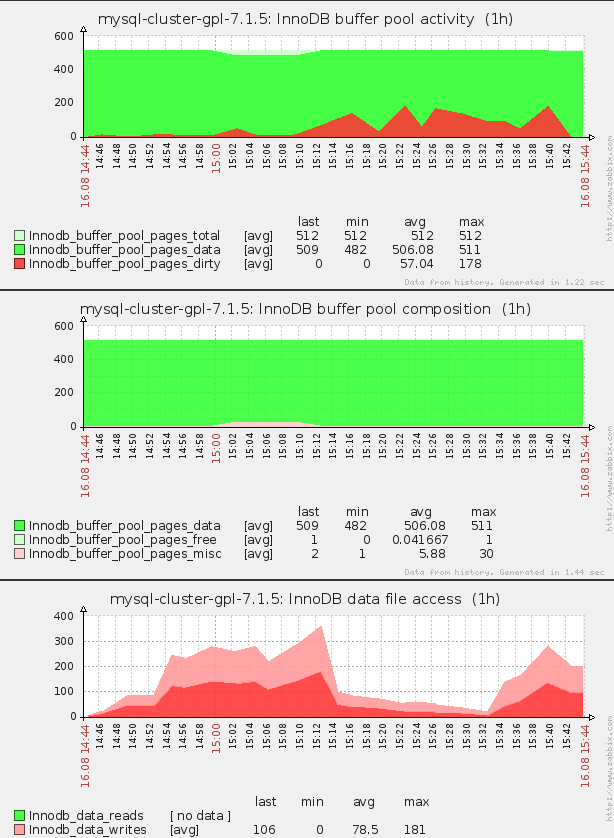
3.2. Some examples of the FromDual Performance Monitor
Details
3.3. Adding the FromDual Performance Monitor Templates to Zabbix
Choose the templates you need. The template fpmmm is mandatory. All other templates are optional but you have to load them if you want to monitor some specific storage engines or features.
If you do not want to think about it install ALL templates. A typical good choice of templates for the machine (aka host or server) is: fpmmm and server and for the a normal MariaDB/MySQL database itself: process, mysql, myisam and innodb.
If you have a Master/Slave Replication running you should add also the master and the slave templates.
Load the Templates (tpl/templates_??/Template_FromDual.*.??.xml) into the Zabbix Monitor (leave all the checkboxes as they are): Configuration → Templates → Import → Select the module → Import.
There should not be any conflict with other rules because a different name space was used for the FromDual modules.
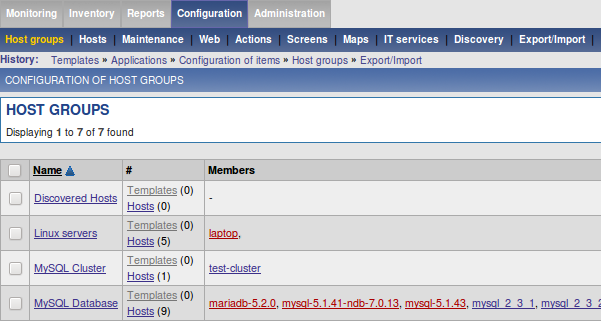
3.4. Creating Zabbix Host Groups
We found, that it is a good idea to create a separate Host Group for your MariaDB/MySQL databases. But you are free to have even a more granular separation or to have just one Host Group.
We miss-use these Host Groups for separating our Databases and our Machines. So the name 'hostgroup' is a bit miss-leading how we used it for our purposes. We do not only monitor hosts but also database instances.
Adding a Zabbix Host Group:
Configuration → Host Groups → Create host group → then enter a group name for example as follows: Database Server and MariaDB/MySQL
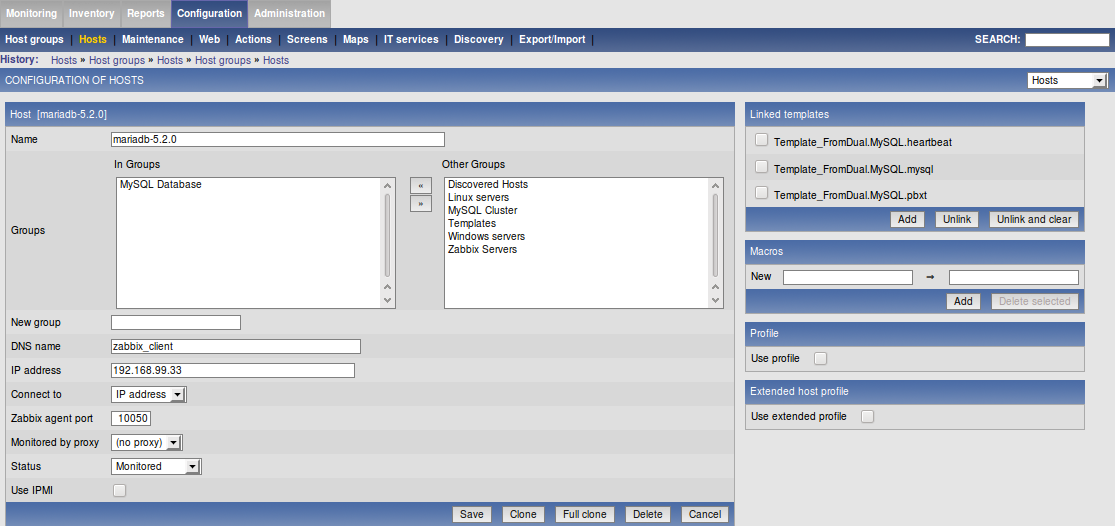
3.5. Creating Hosts on your Zabbix Server
A Host in Zabbix terminology is a "device" you want to monitor. This can be either a machine or a MariaDB/MySQL/PostgreSQL database instance (mariadbd/mysqld) or something else.
For every database instance you want to monitor you have to create 2 hosts, one for the machine and one for the database instance: Configuration → Hosts → Creating host.
Then enter a UNIQUE Name for this Host (= machine or database). Be very careful with choosing the name (in other places also called Hostname). The Name is the identifier for authenticating the Zabbix Agent to the Zabbix Server and is the marker where the data are stored. If the names do not match, the data cannot be sent!
Make sure that Host name matches exactly the hostname specified in fpmmm.conf (my_machine and my_mysqld).
Add this Host to the right Group, add the IP address and Link at least the Template tpl/templates_*/Template_FromDual.MySQL.fpmmm from the Templates tab to the machine host (my_machine) (and possibly some others you have chosen above) and the other templates to the Database Host (my_mysqld). Then save the changes.
Example for the Server:
…
Example for the Database:
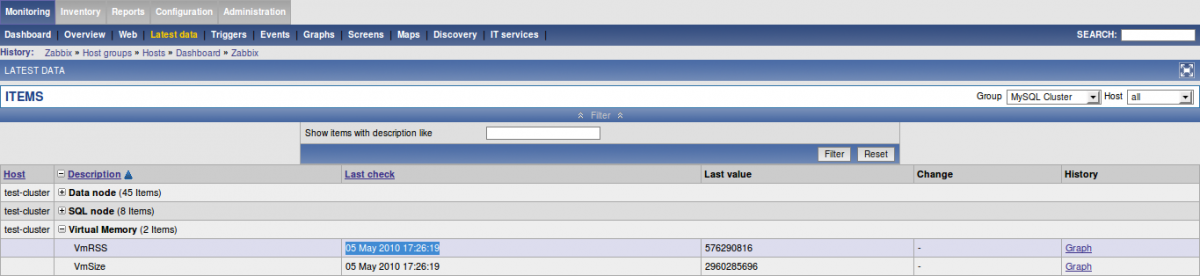
Then check again if your FromDual Performance Monitor data reaches your Zabbix Server: Monitoring → Latest data → fpmmm and check the time stamp of Last check for example.
3.6. Enable the Host for monitoring on Zabbix Server
When you have done all the steps above you can enable the monitored Database Server by clicking on its Not monitored status. In the availability you should see if a certain host is monitored and if not why…
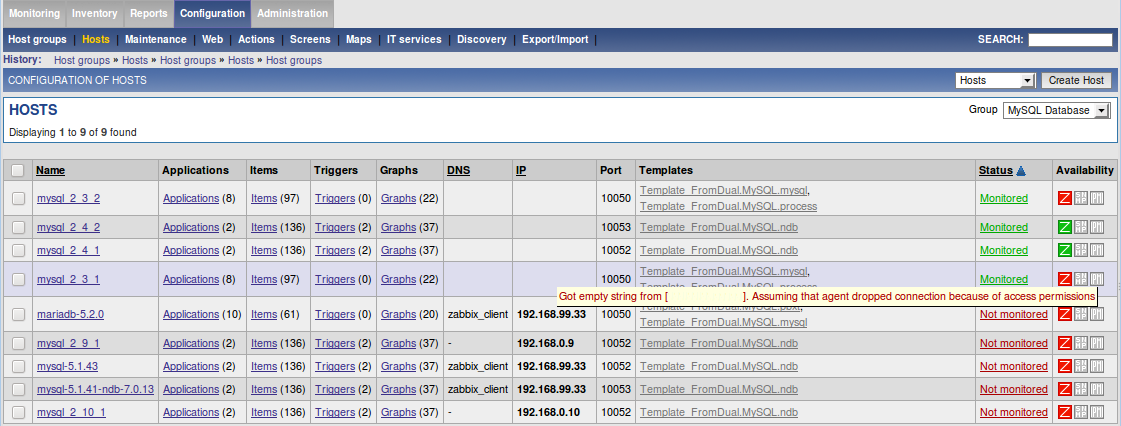
The most common reasons why an agent is not monitored are:
-
Hostname on Zabbix Server and Section in FromDual Performance Monitor Agent configuration file do NOT match.
-
Agent is down or not reachable (firewall, etc.).
To see if data is sent and what the actual values are you can go to:
Monitoring → Latest data → then filter by group and host:
3.7. Regularly running the FromDual Performance Monitor Agent
There are 2 different possibilities to run FromDual Performance Monitor regularly.
-
by the Zabbix Agent
-
by the
crontab
3.7.1. Running the FromDual Performance Monitor by Zabbix Agent
Put the following line either into its own file (/etc/zabbix/conf.d/fpmmm.conf) or add it to the Zabbix Agent configuration file (/etc/zabbix/zabbix_agentd.conf).
#
# /etc/zabbix/zabbix_agentd.conf
#

UserParameter=FromDual.MySQL.check,/opt/fpmmm/bin/fpmmm --config=/etc/fpmmm.conf
Restart the Zabbix agent afterwards:
$ systemctl restart zabbix-agentd
3.7.2. Running the FromDual Performance Monitor by crontab
Add the following line to the crontab:
* * * * * /opt/fpmmm/bin/fpmmm --config=/etc/fpmmm.conf >/dev/null
3.8. Special requirements for specific modules
3.8.1. Special requirements for the DRBD module
If the FromDual Performance Monitor Agent is running under a different user than root not all information will be displayed correctly because of missing privileges.
You either have to run the FromDual Performance Monitor Agent under root (security!) or grant the appropriate rights to the user the Agent is running.
3.9. Troubleshooting
3.9.1. Troubleshooting the Zabbix Server
-
Make sure the Database of the Zabbix Server is up and running:
$ systemctl status mariadb
$ ps -ef | grep mariadbd
$ journalctl -xeu mariadb
Otherwise the Zabbix Web Application will complain and the Zabbix Server will not start.
-
Make sure the Zabbix Server is up and running:
$ systemctl status zabbix-server
$ journalctl -xeu zabbix-server
-
Check the Zabbix Server Log for problems or reasons:
$ tail -n 100 /var/log/zabbix/zabbix_server.log
-
Check if Zabbix Server can connect to its Database. If not, this should be visible in the Zabbix Server Log. In the database you should see some Zabbix Processes connected:
SQL> SHOW PROCESSLIST;
3.9.2. Troubleshooting the Zabbix Web Interface
-
Check if a Webserver (for example Apache) is running so the Zabbix Web Interface can be executed:
$ systemctl status apache2
$ journalctl -xeu apache2
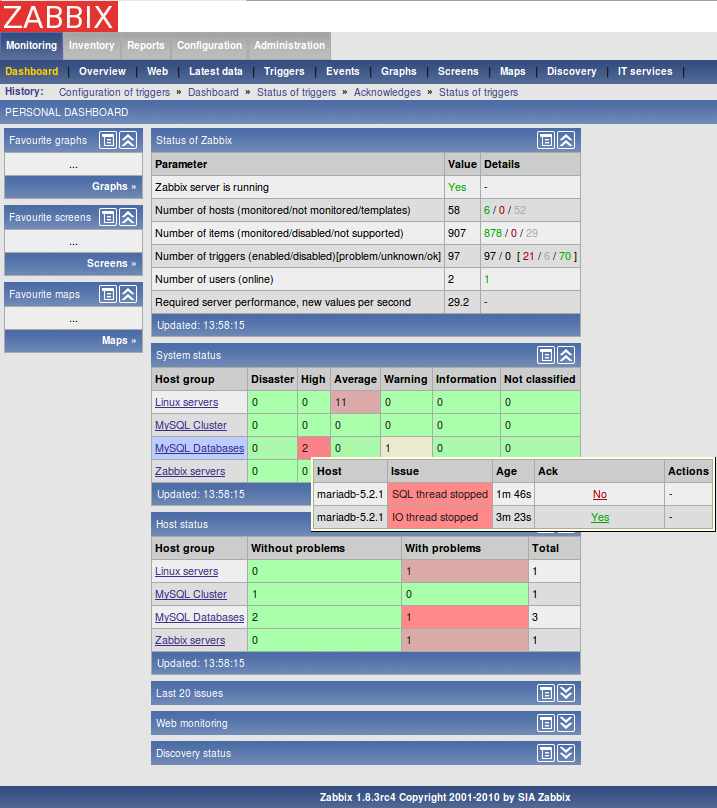
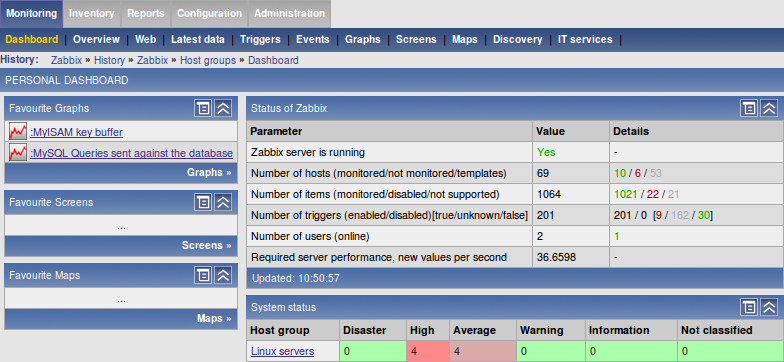
If everything is fine it should look as follows (Zabbix Server is running):
3.9.3. Troubleshooting the Zabbix Agent
-
Make sure the Zabbix Agent is running (check the Zabbix Agent Log).
-
Check if the Status of the Host is Monitored and if Availability is green.
-
If Availability is red and you see the following message:
Got empty string from [137.58.246.161]. Assuming that agent dropped connection because of access permissions
Check if the hostname of the Zabbix Agent matches with the name on the Host in the Zabbix Server (case sensitive, white space etc. matters!). -
Set
DebugLevel = 4in the Zabbix Agent configuration file, restart the agent and see if you can see any reason in the agent log file (do not forget to set it back afterwards because it becomes very verbose). -
Try to send a message manually from as the Zabbix Agent to the Zabbix Server:
$ sudo -u zabbix zabbix_sender --zabbix-server=192.168.0.1 \
--host=mysql_2_4_2 --key=FromDual.MySQLmysql.Questions \
--value="123456789" --verbose
Info from server: "Processed 1 Failed 0 Total 1 Seconds spent 0.000180"
sent: 1; skipped: 0; total: 1
-
Check under: Monitoring → Latest data if the data have been arriving (timestamp).
-
Try to reach the Zabbix Agent from as the Zabbix Server:
$ sudo -u zabbix zabbix_get --host=192.168.0.33 --source-address=192.168.0.1 \
--key="FromDual.MySQL.check"
$ echo $?
141
This typically means that host does not match.
$ sudo -u zabbix zabbix_get --host=192.168.0.33 --source-address=192.168.0.1 \
--key="FromDual.MySQL.check"
ZBX_NOTSUPPORTED
This means that the item FromDual.MySQL.check is not known to the Zabbix Server. Then you have possibly forgotten to add the FromDual Performance Monitor module template to the host you want to monitor.
-
If you run the process module you should make sure, that the user running the Zabbix Agent has access to the PID file. Ideally you run the Zabbix agent with the same user as the database process runs or you configure MariaDB/MySQL in the way that the PID file located on a location where also other processes have access to it.
3.9.4. Troubleshooting the FromDual Performance Monitor Agent
Our philosophy is, that the FromDual Performance Monitor Agent is running under the O/S user mysql. For the FromDual Performance Monitor Agent, this is necessary because otherwise we do not have access to the PID file of the mariadbd / mysqld.
If all those hints do not help or if you have some comments or feedback please let us know (we do NOT cover Zabbix problems).
3.10. Upgrading the FromDual Performance Monitor
The FromDual Performance Monitor can be typically upgraded on the fly without any changes in configuration or any significant downtime.
In FromDual Performance Monitor v2.0.0 we have done some configuration variable changes. So you have to adapt the FromDual Performance Monitor configuration. Please read the FromDual Performance Monitor Release Notes for more details.
Upgrade we typically recommend to update like this:
$ VERSION='m.n.o'
$ cd /opt
$ tar xf /download/fpmmm-${VERSION}.tar.gz
$ rm -f fpmmm ; ln -s fpmmm-${VERSION} fpmmm
If you are using our packages from our Repository the upgrade will be done automatically.
3.11. FromDual Performance Monitor Nagios plug-ins
The FromDual Performance Monitor can also be used for supplying your Nagios Monitoring infrastructure. FromDual Performance Monitor v2.0.0 replaces the former FromDual Nagios plug-ins for MariaDB and MySQL.
3.11.1. Converting Nagios plug-ins to FromDual Performance Monitor
Converting your former FromDual Nagios plug-ins to FromDual Performance Monitor is quite simple. You have to convert the Nagios plugin command to an FromDual Performance Monitor command. Here a simple example:
$ ./check_db_mysql.pl --user=nagios --password=secret --host=127.0.0.1 --port=3306
should be changed to:
$ ./fpmmm --config=/etc/nagios_fpmmm.conf --nagios-plugin=check_db
The former FromDual Nagios plug-in options will be placed in the FromDual Performance Monitor configuration file (/etc/nagios_fpmmm.conf) and should be converted to:
from |
to |
|
|
|
|
|
|
|
|
|
|
A complete FromDual Performance Monitor configuration file converted from the FromDual Nagios plug-ins should look as follows:
Details
#
# /etc/nagios_fpmmm.conf
#

[default]

AgentLockFile = /run/lock/fpmmm/fpmmm.lock
OutputFormat  = nagios
CacheFileBase = /var/cache/fpmmm/fpmmm
Hostname      = my_machine

Username      = fpmmm_agent
Password      = secret
MysqlHost     = 127.0.0.1
MysqlPort     = 3306
Socket        = /var/lib/mysql/mysql.sock
A list of all commands how they should be converted from Nagios plug-ins to FromDual Performance Monitor:
Details
$ ./check_db_mysql.pl --user=nagios --password=secret --host=127.0.0.1 --port=3306
$ ./bin/fpmmm --config=/etc/nagios_fpmmm.conf --nagios-plugin=check_db

$ ./check_repl_mysql_cnt_slave_hosts.pl --user=nagios --password=secret --host=127.0.0.1 --port=3306 --expected=3 --critical=1 --warning=2
$ ./bin/fpmmm --config=/etc/nagios_fpmmm.conf --nagios-plugin=check_repl_cnt_slave_hosts --expected=3 --critical=1 --warning=2

$ ./check_repl_mysql_io_thread.pl --user=nagios --password=secret --host=127.0.0.1 --port=3306
$ ./bin/fpmmm --config=/etc/nagios_fpmmm.conf --nagios-plugin=check_repl_io_thread

$ ./check_repl_mysql_sql_thread.pl --user=nagios --password=secret --host=127.0.0.1 --port=3306
$ ./bin/fpmmm --config=/etc/nagios_fpmmm.conf --nagios-plugin=check_repl_sql_thread

$ ./check_repl_mysql_read_exec_pos.pl --user=nagios --password=secret --host=127.0.0.1 --port=3306 --critical=100000 --warning=10000
$ ./bin/fpmmm --config=/etc/nagios_fpmmm.conf --nagios-plugin=check_repl_read_exec_pos --critical=100000 --warning=10000

$ ./check_repl_mysql_seconds_behind_master.pl --user=nagios --password=secret --host=127.0.0.1 --port=3306 --critical=60 --warning=10
$ ./bin/fpmmm --config=/etc/nagios_fpmmm.conf --nagios-plugin=check_repl_seconds_behind_master --critical=60 --warning=10

$ ./check_repl_mysql_readonly.pl --user=nagios --password=secret --host=127.0.0.1 --port=3306
$ ./bin/fpmmm --config=/etc/nagios_fpmmm.conf --nagios-plugin=check_repl_readonly

$ ./check_galera_nodes.pl --user=nagios --password=secret --host=127.0.0.1 --port=3306 --nodes=3
$ ./bin/fpmmm --config=/etc/nagios_fpmmm.conf --nagios-plugin=check_galera_nodes --nodes=3

$ ./check_repl_mysql_heartbeat.pl --master-user=nagios --master-password=secret --master-host=192.168.1.1 --master-port=3306 --slave-user=nagios --slave-password=secret --slave-host=192.168.1.2 --slave-port=3306 --heartbeat-schema=test --heartbeat-table=heartbeat --heartbeat-beat-field=beat --heartbeat-id-field=id --heartbeat-id=1
$ ./bin/fpmmm --config=/etc/nagios_fpmmm.conf --nagios-plugin=check_repl_heartbeat --master-user=nagios --master-password=secret --master-host=192.168.1.1 --master-port=3306 --slave-user=nagios --slave-password=secret --slave-host=192.168.1.2 --slave-port=3306 --heartbeat-schema=test --heartbeat-table=heartbeat --heartbeat-beat-field=beat --heartbeat-id-field=id --heartbeat-id=1

$ ./check_errorlog_mysql.pl --error-log=/var/log/mysql/chef_mariadb-107_error.log --configuration=/var/lib/fpmmm/fpmmm_error_log.state --instance=mariadb-107
$ ./bin/fpmmm --config=/etc/nagios_fpmmm.conf --nagios-plugin=check_errorlog --error-log=/var/log/mysql/chef_mariadb-107_error.log --configuration=/var/lib/fpmmm/fpmmm_error_log.state --instance=mariadb-107

$ ./perf_mysql.pl --user=nagios --password=secret --host=127.0.0.1 --port=3306 --output=nagios --module=uptime
$ ./bin/fpmmm --config=/etc/nagios_fpmmm.conf --nagios-plugin=perf --output=nagios --module=uptime
If you seek for Nagios plug-in specific help you can run the following command:
$ ./bin/fpmmm --config=/etc/nagios_fpmmm.conf --nagios-plugin=perf --output=nagios --module=uptime --help
3.11.2. Set-up Nagios NRPE Agent
This should be done on the machine to monitor (client) - where the database resides.
$ apt-get install nagios-nrpe-server nagios-plugins-basic
$ systemctl status nagios-nrpe-server
$ systemctl start nagios-nrpe-server
$ /usr/lib/nagios/plugins/check_nrpe --host=localhost --command=check_users
USERS OK - 1 users currently logged in |users=1;5;10;0
Add Nagios Monitoring Server:
# /etc/nagios/nrpe.cfg
allowed_hosts=127.0.0.1,::1,192.168.56.102
Add FromDual Performance Monitor agent commands:
# /etc/nagios/nrpe_local.cfg

command[fpmmm_check_db]=/opt/fpmmm/bin/fpmmm --config=/etc/fpmmm.conf --nagios-plugin=check_db

command[fpmmm_check_repl_cnt_slave_hosts]=/opt/fpmmm/bin/fpmmm --config=/etc/fpmmm.conf --nagios-plugin=check_repl_cnt_slave_hosts --expected=3 --critical=1 --warning=2
command[fpmmm_check_repl_io_thread]=/opt/fpmmm/bin/fpmmm --config=/etc/fpmmm.conf --nagios-plugin=check_repl_io_thread
command[fpmmm_check_repl_sql_thread]=/opt/fpmmm/bin/fpmmm --config=/etc/fpmmm.conf --nagios-plugin=check_repl_sql_thread
command[fpmmm_check_repl_read_exec_pos]=/opt/fpmmm/bin/fpmmm --config=/etc/fpmmm.conf --nagios-plugin=check_repl_read_exec_pos --critical=100000 --warning=10000
command[fpmmm_check_repl_seconds_behind_master]=/opt/fpmmm/bin/fpmmm --config=/etc/fpmmm.conf --nagios-plugin=check_repl_seconds_behind_master --critical=60 --warning=10
command[fpmmm_check_repl_readonly]=/opt/fpmmm/bin/fpmmm --config=/etc/fpmmm.conf --nagios-plugin=check_repl_readonly
command[fpmmm_check_repl_heartbeat]=/opt/fpmmm/bin/fpmmm --config=/etc/fpmmm.conf --nagios-plugin=check_repl_heartbeat --master-user=nagios --master-password=secret --master-host=192.168.1.2 --master-port=3306 --slave-user=nagios --slave-password=secret --slave-host=192.168.1.2 --slave-port=3306 --heartbeat-schema=test --heartbeat-table=heartbeat --heartbeat-beat-field=beat --heartbeat-id-field=id --heartbeat-id=1

command[fpmmm_check_galera_nodes]=/opt/fpmmm/bin/fpmmm --config=/etc/fpmmm.conf --nagios-plugin=check_galera_nodes --nodes=3

command[fpmmm_check_errorlog]=/opt/fpmmm/bin/fpmmm --config=/etc/fpmmm.conf --nagios-plugin=check_errorlog --error-log=/var/log/mysql/mysqld.log --configuration=/tmp/fpmmm_error_log.state --instance=mariadb-107

command[fpmmm_perf_uptime]=/opt/fpmmm/bin/fpmmm --config=/etc/fpmmm.conf --nagios-plugin=perf --output=nagios --module=uptime
command[fpmmm_perf_connections]=/opt/fpmmm/bin/fpmmm --config=/etc/fpmmm.conf --nagios-plugin=perf --output=nagios --module=connections
command[fpmmm_perf_galera]=/opt/fpmmm/bin/fpmmm --config=/etc/fpmmm.conf --nagios-plugin=perf --output=nagios --module=galera
command[fpmmm_perf_thread_cache]=/opt/fpmmm/bin/fpmmm --config=/etc/fpmmm.conf --nagios-plugin=perf --output=nagios --module=thread_cache
command[fpmmm_perf_network_traffic]=/opt/fpmmm/bin/fpmmm --config=/etc/fpmmm.conf --nagios-plugin=perf --output=nagios --module=network_traffic
command[fpmmm_perf_queries]=/opt/fpmmm/bin/fpmmm --config=/etc/fpmmm.conf --nagios-plugin=perf --output=nagios --module=queries
command[fpmmm_perf_query_cache]=/opt/fpmmm/bin/fpmmm --config=/etc/fpmmm.conf --nagios-plugin=perf --output=nagios --module=query_cache
command[fpmmm_perf_myisam_key_buffer]=/opt/fpmmm/bin/fpmmm --config=/etc/fpmmm.conf --nagios-plugin=perf --output=nagios --module=myisam_key_buffer
command[fpmmm_perf_table_cache]=/opt/fpmmm/bin/fpmmm --config=/etc/fpmmm.conf --nagios-plugin=perf --output=nagios --module=table_cache
command[fpmmm_perf_temporary_tables]=/opt/fpmmm/bin/fpmmm --config=/etc/fpmmm.conf --nagios-plugin=perf --output=nagios --module=temporary_tables
command[fpmmm_perf_tables]=/opt/fpmmm/bin/fpmmm --config=/etc/fpmmm.conf --nagios-plugin=perf --output=nagios --module=tables
command[fpmmm_perf_slow_queries]=/opt/fpmmm/bin/fpmmm --config=/etc/fpmmm.conf --nagios-plugin=perf --output=nagios --module=slow_queries
command[fpmmm_perf_bin_log]=/opt/fpmmm/bin/fpmmm --config=/etc/fpmmm.conf --nagios-plugin=perf --output=nagios --module=bin_log
command[fpmmm_perf_innodb_buffer_pool]=/opt/fpmmm/bin/fpmmm --config=/etc/fpmmm.conf --nagios-plugin=perf --output=nagios --module=innodb_buffer_pool
command[fpmmm_perf_innodb_buffer_pool_io]=/opt/fpmmm/bin/fpmmm --config=/etc/fpmmm.conf --nagios-plugin=perf --output=nagios --module=innodb_buffer_pool_io
command[fpmmm_perf_innodb_io]=/opt/fpmmm/bin/fpmmm --config=/etc/fpmmm.conf --nagios-plugin=perf --output=nagios --module=innodb_io
command[fpmmm_perf_innodb_data]=/opt/fpmmm/bin/fpmmm --config=/etc/fpmmm.conf --nagios-plugin=perf --output=nagios --module=innodb_data
command[fpmmm_perf_innodb_logfile]=/opt/fpmmm/bin/fpmmm --config=/etc/fpmmm.conf --nagios-plugin=perf --output=nagios --module=innodb_logfile
command[fpmmm_perf_innodb_row_locking]=/opt/fpmmm/bin/fpmmm --config=/etc/fpmmm.conf --nagios-plugin=perf --output=nagios --module=innodb_row_locking
command[fpmmm_perf_innodb_queries]=/opt/fpmmm/bin/fpmmm --config=/etc/fpmmm.conf --nagios-plugin=perf --output=nagios --module=innodb_queries
Then restart the Nagios NRPE server:
$ systemctl restart nagios-nrpe-server
FromDual Performance Monitor agent running with Nagios plug-ins:
$ sudo -u nagios /opt/fpmmm/bin/fpmmm --config=/etc/fpmmm.conf --nagios-plugin=check_db
Database seems up and running...
Check for errors:
$ tail /var/log/fpmmm/fpmmm.log
Combination of both:
$ chown nagios: /etc/fpmmm.conf
$ chown -R nagios: /var/log/fpmmm
$ chown -R nagios: /run/lock/fpmmm
$ /usr/lib/nagios/plugins/check_nrpe --host=localhost --command=fpmmm_check_db
Database seems up and running...

$ /usr/lib/nagios/plugins/check_nrpe --host=localhost --command=fpmmm_check_repl_readonly
...
$ /usr/lib/nagios/plugins/check_nrpe --host=localhost --command=fpmmm_perf_uptime
...
3.11.3. Set-up Nagios Monitoring Server
$ apt-get install nagios-nrpe-server
$ /usr/lib/nagios/plugins/check_nrpe --host=192.168.56.108
NRPE v4.0.3
Set the NRPE Check on the Server Configuration file:
$ /usr/lib/nagios/plugins/check_nrpe --host=192.168.56.108 --unknown-timeout --timeout=5 --command=fpmmm_check_db
Database seems up and running...

$ /usr/lib/nagios/plugins/check_nrpe --host=192.168.56.108 --command=fpmmm_check_repl_readonly
...
$ /usr/lib/nagios/plugins/check_nrpe --host=192.168.56.108 --command=fpmmm_perf_uptime
...
Define your database machine and the services to monitor:
# /etc/nagios4/nagios.cfg
cfg_file=/etc/nagios4/objects/nrpeclient.cfg

# /etc/nagios4/objects/nrpeclient.cfg
define host {
  use                 linux-server
  host_name           debian11
  alias               debian11.rebenweg
  address             192.168.56.108
  max_check_attempts  3
  contact_groups      admins
}

define hostgroup {
  hostgroup_name      databases
  alias               MariaDB and MySQL databases
  members             debian11
}

define service {
  use                 generic-service
  host_name           debian11
  service_description fpmmm check_db
  check_command       check_nrpe!fpmmm_check_db
}

define service {
  use                 generic-service
  host_name           debian11
  service_description fpmmm check_repl_readonly
  check_command       check_nrpe!fpmmm_check_repl_readonly
}

define service {
  use                 generic-service
  host_name           debian11
  service_description fpmmm perf_uptime
  check_command       check_nrpe!fpmmm_perf_uptime
}
Test configuration and restart Nagios
$ /usr/sbin/nagios4 -v /etc/nagios4/nagios.cfg
$ systemctl restart nagios4
Then you should see the results in your web-browser.
3.11.4. Sources
3.12. SNMP Monitoring
Since v2.0.0 the FromDual Performance Monitor allows you to monitor your MariaDB and MySQL databases via SNMP (Simple Network Management Protocol).
This feature enables you to report your database metrics into Enterprise Monitoring solutions from Microsoft, IBM or into Oracle Cloud Control.
On this page we will show you the few simple steps it needs to send the data from your FromDual Performance Monitor Agent to your SNMP Manager.
3.12.1. Check if SNMP Manager can be reached
To make sure FromDual Performance Monitor can send data to the SNMP Manager at all you can test the connection with the following command to send SNMP Notifications to the SNMP Manager:
Details
$ COMMUNITY='public'
$ MANAGER='192.168.56.102'
$ PORT='162'
$ TRAP_OID='1.3.6.1.4.1.57800.1.1.2'
$ OID='1.3.6.1.4.1.57800.1.1.1'
$ TYPE='c'
$ VALUE=$(mariadb --user=root --execute="SELECT variable_value FROM information_schema.global_status WHERE variable_name LIKE 'threads_running'\G" | grep variable_value | cut -d' ' -f2)

$ snmptrap -v 2c -c ${COMMUNITY} ${MANAGER}:${PORT} '' ${TRAP_OID} ${OID} ${TYPE} "${VALUE}"
Then check in the SNMP Manager Logfile if the traps arrive.
3.12.2. Copy FromDual Performance Monitor MIBs to your FromDual Performance Monitor Agent Machine
You can see where your FromDual Performance Monitor MIBs are expected on your database machine (where your FromDual Performance Monitor Agent is located) with the following command:
$ net-snmp-config --default-mibdirs
${HOME}/.snmp/mibs:/usr/share/snmp/mibs:/usr/share/snmp/mibs/iana:/usr/share/snmp/mibs/ietf:/usr/share/mibs/site:/usr/share/snmp/mibs:/usr/share/mibs/iana:/usr/share/mibs/ietf:/usr/share/mibs/netsnmp
Copy the FromDual Performance Monitor MIBs as follows (we assume that you work with the same user as your FromDual Performance Monitor Agent works (zabbix or mariadb/mysql)):
$ mkdir -p ${HOME}/.snmp/mibs
$ cp /opt/fpmmm/tpl/FromDual-fpmmm-MIB.mib ${HOME}/.snmp/mibs
or choose any other location you want to have them.
To check if the FromDual MIBs are recognized correctly run these commands:
$ snmptranslate -DFromDual-fpmmm-MIB.mib -m +FromDual-fpmmm-MIB 1.3.6.1.4.1.57800.1.1.1
registered debug token FromDual-fpmmm-MIB.mib, 1
FromDual-fpmmm-MIB::fpmmmLastrun

$ snmptranslate -On FromDual-fpmmm-MIB::fpmmmLastrun
.1.3.6.1.4.1.57800.1.1.1
Do the same for the SNMP Manager according to your installation instructions of your SNMP Manager.
3.12.3. Configure your FromDual Performance Monitor to send SNMP traps
The FromDual Performance Monitor Configuation File (/etc/fpmmm.conf) should contain at least the following lines to make FromDual Performance Monitor sending SNMP traps instead of Zabbix messages:
[default]

# SNMP Server
SnmpServer    = 192.168.56.102
SnmpCommunity = public
SnmpTrapPort  = 162

OutputFormat  = snmp
Do a test run of FromDual Performance Monitor with:
$ /opt/fpmmm/bin/fpmmm --config=/etc/fpmmm.conf
Then check again on your SNMP Server machine if the SNMP traps arrive:
Details
snmptrapd: Agent Address: 0.0.0.0
Agent Hostname:
Date: 1 - 1 - 4 - 1 - 1 - 1970
Enterprise OID: .
Trap Type: Cold Start
Trap Sub-Type: 0
Community/Infosec Context: TRAP2, SNMP v2c, community public
Uptime: 0
Description: Cold Start
PDU Attribute/Value Pair Array:#012DISMAN-EVENT-MIB::sysUpTimeInstance = Timeticks: (1215419) 3:22:34.19#012SNMPv2-MIB::snmpTrapOID.0 = OID: SNMPv2-SMI::enterprises.57800.1.1.2#012SNMPv2-SMI::enterprises.57800.1.1.1 = Counter32: 3

snmptrapd: Agent Address: 0.0.0.0
Agent Hostname:
Date: 1 - 1 - 4 - 1 - 1 - 1970
Enterprise OID: .
Trap Type: Cold Start
Trap Sub-Type: 0
Community/Infosec Context: TRAP2, SNMP v2c, community public
Uptime: 0
Description: Cold Start
PDU Attribute/Value Pair Array:#012DISMAN-EVENT-MIB::sysUpTimeInstance = Timeticks: (60) 0:00:00.60#012SNMPv2-MIB::snmpTrapOID.0 = OID: SNMPv2-SMI::enterprises.57800.1.1.2#012SNMPv2-SMI::enterprises.57800.2.7.1 = Counter32: 1

snmptrapd: Agent Address: 0.0.0.0
Agent Hostname:
Date: 1 - 1 - 4 - 1 - 1 - 1970
Enterprise OID: .
Trap Type: Cold Start
Trap Sub-Type: 0
Community/Infosec Context: TRAP2, SNMP v2c, community public
Uptime: 0
Description: Cold Start
PDU Attribute/Value Pair Array:#012DISMAN-EVENT-MIB::sysUpTimeInstance = Timeticks: (60) 0:00:00.60#012SNMPv2-MIB::snmpTrapOID.0 = OID: SNMPv2-SMI::enterprises.57800.1.1.2#012SNMPv2-SMI::enterprises.57800.2.7.2 = Counter32: 151

snmptrapd: Agent Address: 0.0.0.0
Agent Hostname:
Date: 1 - 1 - 4 - 1 - 1 - 1970
Enterprise OID: .
Trap Type: Cold Start
Trap Sub-Type: 0
Community/Infosec Context: TRAP2, SNMP v2c, community public
Uptime: 0
Description: Cold Start
PDU Attribute/Value Pair Array:#012DISMAN-EVENT-MIB::sysUpTimeInstance = Timeticks: (60) 0:00:00.60#012SNMPv2-MIB::snmpTrapOID.0 = OID: SNMPv2-SMI::enterprises.57800.1.1.2#012SNMPv2-SMI::enterprises.57800.2.7.1 = Counter32: 1

snmptrapd: Agent Address: 0.0.0.0
Agent Hostname:
Date: 1 - 1 - 4 - 1 - 1 - 1970
Enterprise OID: .
Trap Type: Cold Start
Trap Sub-Type: 0
Community/Infosec Context: TRAP2, SNMP v2c, community public
Uptime: 0
Description: Cold Start
PDU Attribute/Value Pair Array:#012DISMAN-EVENT-MIB::sysUpTimeInstance = Timeticks: (60) 0:00:00.60#012SNMPv2-MIB::snmpTrapOID.0 = OID: SNMPv2-SMI::enterprises.57800.1.1.2#012SNMPv2-SMI::enterprises.57800.2.7.3 = Counter32: 1
This is already all about making FromDual Performance Monitor capable sending SNMP traps.
3.12.4. Sources
3.13. Monitoring PostgreSQL with FromDual Performance Monitor
|
Note
|
This feature is supported since v2.2.0. |
Rudimentary PostgreSQL monitoring is implemented in FromDual Performance Monitor.
To make PostgreSQL monitoring working you have to create a database user in PostgreSQL, add a configuration section in your FromDual Performance Monitor configuration file (fpmmm.conf) and load the Zabbix template (Template_FromDual.db.postgresql_*.xml) into your Zabbix monitor.
Create database user in PostgreSQL:
postgres=# CREATE USER fpmmm_agent WITH PASSWORD 'secret';
CREATE ROLE

postgres=# GRANT pg_use_reserved_connections TO fpmmm_agent;
GRANT ROLE

postgres=# GRANT pg_read_all_stats TO fpmmm_agent;
GRANT ROLE
Add PostgreSQL database into FromDual Performance Monitor configuration file:
[postgresql-18]

Type          = postgresql

Username      = fpmmm_agent
Password      = secret
PostgresPort  = 5432
PostgresHost  = 127.0.0.1

Modules       = postgresql
DbPidFile     = /var/lib/postgresql/18/main/postmaster.pid
4. Enterprise Subscription and Support
For commercial use you have to purchase an Enterprise Subscription for the FromDual Performance Monitor. This subscription includes:
-
Notice of available updates for all modules.
-
Access to newest Releases of the MySQL Performance Monitor.
-
Best effort email support for all the FromDual modules. Contact our contact for getting support.
-
Opportunity to suggest enhancement requests.
The Enterprise subscription can be purchased via e-mail. This support does NOT contain Zabbix Support! Commercial support for Zabbix you can get from Zabbix directly.
If the installation of the FromDual Performance Monitor is part of a consulting engagement, the support for the first year is free.
5. Release Notes
Release notes see here.
6. Questions and Answers (Q & A)
|
Important
|
For technical details check our User Guide. |
-
What is the FromDual Performance Monitor License?
FromDual Performance Monitor is licensed under the FromDual Enterprise Tools License.
-
What are the FromDual Performance Monitor costs?
FromDual Performance Monitor is free of costs for trial and non-commercial use. For commercial use the yearly fee depends on the amount of database instances you want to operate under FromDual Performance Monitor. Please ask FromDual for a quote.
-
Is the FromDual Performance Monitor free of costs?
FromDual Performance Monitor is free of costs for trial and non-commercial use.